
At a major public company's plant, output was never measured. Production planning was performed on the basis of machine work hours for each product, and there was no control undertaken on this either (how many actual production hours for each product in comparison with production planning). As the objective is to produce some kind of product, or to provide a service, we need to measure output and not the hours during which we have manufactured or planned production.
The method of production planning according to work hours has not served the objective of output supply to sales. The major company owner asked me to help him "sort out his production", as he put it.
At the other end of the scale (from the aspect of company size), at a very small company, the owner experienced a similar situation: he could not increase his sales because he didn't have enough output. He asked for my assistance in convincing his workers to work extra hours. There, too, the situation was the same: the output did not undergo any monitoring and was far from being optimal.
OEE: Overall Equipment Effectiveness
The OEE measure is the best tool to measure efficiency and to improve it and, therefore, the output. Working correctly will give us not only the optimal measure of production efficiency, but will also reveal the weak points in the system. And the weak points we can improve.
Around two years ago, I published an article on the OEE measure, where I presented the tool and the potential production line situations and resultant loss of efficiency. For those not familiar with this tool, I highly recommend to read and review the details.
This is one of the more popular articles on my blog and I get a lot of questions on how to implement the method. In this article, I will present the work method to detect and improve weak points in the system.
The truth is that the moment we were able to identify the weak points that inhibit optimal production, the necessary improvement was usually simple and inexpensive.
Detection and measuring of weak points
In order to improve efficiency and output, we will need to make measurements and use an activity log. The measures will provide us with a direction – where we are in comparison to potential optimal yield (see below), and the listings in the activity log will enable us to identify the points of weakness. However, before we cope with weak points in the production system, we must cope with two obstacles or challenges: the measurements and subsequent listings in the activity log.
Nobody likes to be monitored, which is why there is such widespread objection to any sort of measure. But the measuring constitutes an enormous opportunity to improve and to encourage interest in your workers. On the other hand, it does pose a threat to workers. If we don't involve our workers in the process, they will view it as management monitoring them and following them. If we do not change this approach, we will not obtain cooperation.
In order to involve workers and attain a significant improvement, we will share with them and present the objective of the process, and, together with them as an improvement team, we will analyze the results and discuss potential improvements.
Before I explain how to make log listings and analyze results, let's define a few terms.
For those who have not read the previous article, here is a brief review of some of the definitions:
The line can produce or not produce.
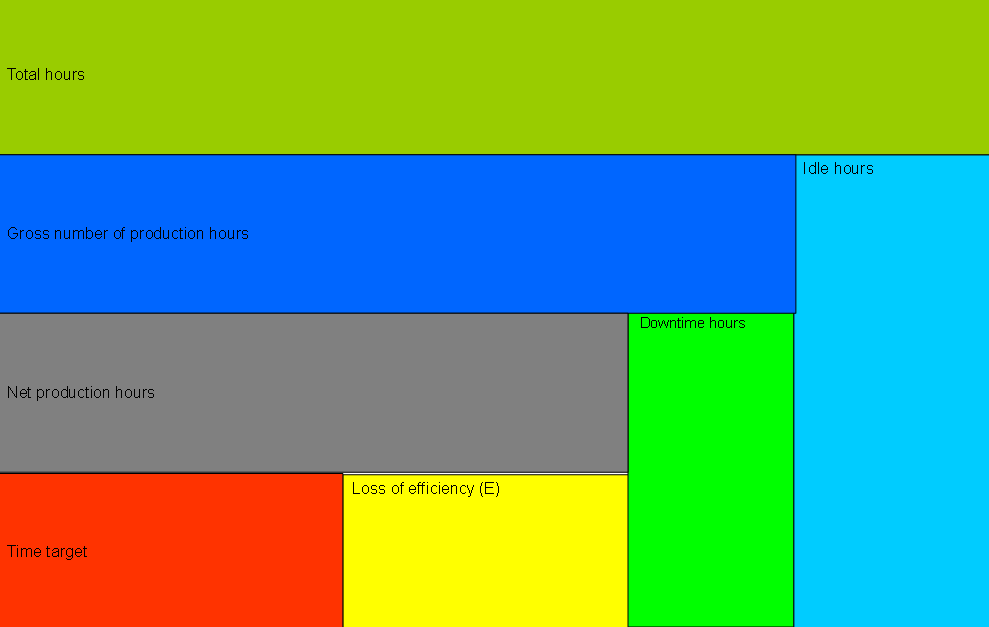
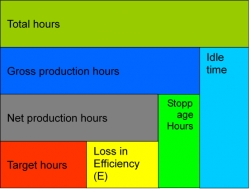
First, we will define the types of stoppages or lack of output, and then we will examine the classification of production hours.
There are three possibilities for the line not being in production:
- The line is not set for production – we will call this "idle hours". For example, legal prohibition from production (Shabbat) or lack of orders.
- The line is not in production, but there are tuning activities on the line like preventive maintenance or set up. We will call this "downtime hours".
- The line is set for production but is not in operation. For example, lack of materials, workers, machine failures or loss of output due to quality problems, reprocessing or slowing of production speed. We will call this "loss of efficiency".
Now let's define the times:
- Gross hours comprise all of the hours during which we can manufacture.
- Net hours comprise the hours we have planned for production.
- Target time is the quantity of hours during which we could produce the output we would produce if we operated the line at its theoretical optimal speed.
- The difference between net hours and target hours is known as loss of efficiency.
- Theoretical optimal output is the output that can be produced if the line works at optimal speed without breaks or stoppages for any reason whatsoever. It is clear that this isn't realistic, but it serves as our reference point according to which we calculate the target time.
- Bottleneck: the theoretical optimal output refers to the bottleneck on the production line.
Example:
The plant produces for 20 hours and the actual output is 6,000 units, with theoretical optimal output being 500 units per hour.
In other words, theoretically, we should be able to produce 6,000 units with 12 hours as the target time.
We can now see that we have a loss in efficiency of 8 hours. That's a figure of 40% loss in efficiency (8 "extra" hours out of the 20 hours we produced). And by the way, these figures were very realistic (before we implemented our improvements).
How do we measure and improve?
The implementation occurs in four stages:
- Listing of data in production log by the workers.
- Entering this data into our Excel spreadsheet or other computerized system.
- Data analysis: determining root factors for the loss of efficiency and the generation of corrective action with the improvement team.
- Implementation of the improvements
The data to be listed in the production log are:
- Actual output packaged (output that is not yet packaged and is sitting in intermediary inventory is not counted).
- Gross production hours (see above for definition) where the production line is intended to be in operation.
- Downtime hours in the relevant classifications. Here, we list only the number of hours. Usually we divide these into operative downtime hours (eg. cleaning, setup, planned maintenance, repackaging or imperfect product), stoppage due to workers (lack of workers or meal breaks, etc.), stoppage due to mechanical or processual failures. Listing the number of these hours will help focus on the principal reasons according to the Pareto principle.
- Reasons for stoppage. Listing the reasons will enable us to analyze the root factors for the stoppage and will generate corrective or preventive actions.
Excel spreadsheet:
Below, I will present an example (in parts) of an Excel spreadsheet. You can obtain the full spreadsheet from me.
Listings are daily, but sometimes, in the improvement team, we will examine the weekly summary.
The portion of the details collected:
| Day | Date | Total kg packaged per day | Gross production hours where the line is set intended for operation | Operative downtime (cleaning, set-up, packaging of imperfect product | Employee downtime (meals, absences, etc.) | Downtime hours due to processual failure | Reasons |
The portion of calculated data (note that the data calculated by Excel are in the green columns. In the purple column, target output, we will enter the data we have determined:
| Total downtime hours | Total net production hours | Total net production hours in % | Target output in bottleneck on line per hour | Target time for production according to theoretical output |
The measures:
| Line efficiency in % | Line performance in % | Loss in tons or packaged units vs. theoretical output |
Line efficiency in % refers to net production hours in comparison with target hours (the hours during which you were able to produce at theoretical optimal output).
Line performance in % refers to gross production hours in comparison to target hours. This is the most important detail and it cannot be biased.
Loss of efficiency or loss in tons translates the loss in efficiency in % to tons of output (or packaged units). It is easier for us to understand loss of efficiency in output in tons or packaged units and to illustrate to ourselves the degree of the loss.
Presentation of the measures and follow-up
It is important to perform a visual follow-up using graphs. The follow-up enables us to see if there has been any improvement. If there hasn't, something in the manner in which we are operating is not right. We will examine this and change our method of operation.
If there has been an improvement, it will remind all of us, workers and managers, where we were, where we have arrived at and will provide satisfaction and motivation to continue.
Summary
I meet with a lot of companies who do not perform any measures at all, or do not measure their output. The OEE measure is the best tool I know for measuring and leading significant improvements in production efficiency.
A process like this entails involving the employees and working with an improvement team. There are companies that place the responsibility of measurements in the hands of the workers and the managers are the one who analyze and determine the improvements. This manner of working creates resistance among workers – it does not generation a significant improvement and will not last for very long.


 My First Book: Manage! Best Value Practices for Effective Management