
Links to previous articles in the series can be found at the end of the article.
The current series of articles focuses on the important KPIs every business must monitor. I have written articles regarding this very important issue over the past few years. However, the current series presents the KPIs in a concise form, easily expanded, when required.
Part VII is the last chapter in the series. It includes a short summary of the previous chapters.
It is important to remember that improvements start with measuring and monitoring. The results must then be followed, using Root Cause Analyses, and corrective and preventive actions must be implemented.
Important KPIs for random implication
First KPI: Products’ contribution to operational profit and EBITA
Does your company offer similar products with very small changes to different customers? Salesmen sometimes believe that offering to make “small changes” to products to meet the customers’ demand will increase sales. However, customers may eventually choose not to purchase the product they originally contemplated, and the product may accumulate on the shelves with no prospect of being sold. I often see in merchandise companies, thousands of products, almost entirely identical – sitting on the shelves with no sales movement.
The situation is not different in manufacturing companies that manufacture products that could have had substantial sales value, but do not contribute to profit and may even generate losses.
Assessment of products’ contribution towards the company’s profit is one of the KPIs worthy of monitoring periodically. I recommend annually or biannually.
Cost of manufacturing increases in accordance with variety of products. Dead stock leads to high complexity of the manufacturing process and supply chain management.
Assessing which products contribute to profit or EBITA and which do not?
It is important to measure and analyze. Read my explanation in part I of the series.
In an article I published a few years ago I presented an analysis of products’ profitability and complexity.
The following graph presented products’ profitability, complexity and sales volume:
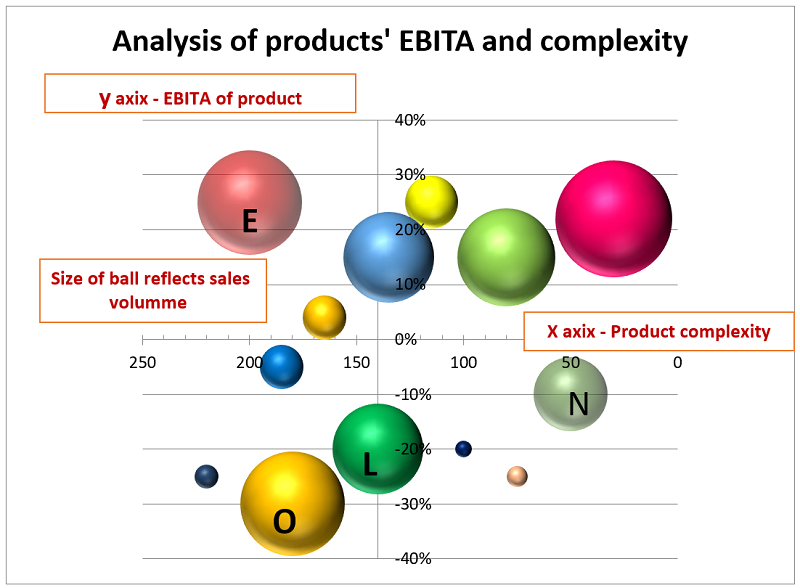
The graph visualized an unexpected situation.
The graph was analyzed and an action plan was formed.
First, the graph presented a few products that pushed profitability down.
Products L, O & N presented a big problem, but since they were sold in high volumes, we tested whether their profitability could be improved, or their manufacturing had to stop.
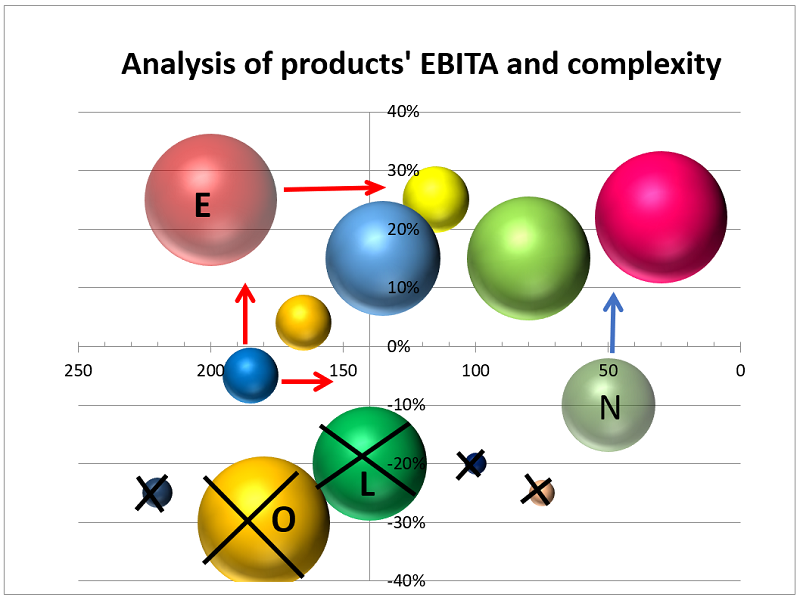
The decision regarding the small products which showed negative profitability was to stop manufacturing immediately.
Product E presented good profitability but high complexity. Therefore, a team was appointed to examine ways to reduce the product complexity.
Other products were analyzed to find ways to reduce complexity in the future.
The following graph presents the decisions taken for the first stage of actions.
Note that many types of products (catalogue numbers or SKU’s) increase logistics complexity even before looking into profitability.
Second KPI: Bill of material (BOM) precision
Monitoring how accurately manufacturing BOM is performed is another KPI worthy of checking periodically, once a year or once every few months.
I assume that the results of this KPI will surprise management at every check. This is because changes during the manufacturing process are often made following verbal instructions which are not recorded in the product specifications. Changes may also occur due to inaccurate manufacturing process. Whatever the reason, implementation of this KPI is required to improve operational management. It is important to document the tests’ process and the results of each BOM tested.
Measuring is the first step towards improvement.
Third KPI: Customers’ feedback
Customers’ feedback achieves four goals:
- Enables “Improving trough learning” – If the right questions are asked, the right conclusions will be drawn.
- Increases and enhances customers’ satisfaction.
Satisfied customers are reminded of their satisfaction while providing feedback. It retains their loyalty. Unsatisfied customers are happy to know that the vendor values their opinion their comments will lead to improvements. - Remind and encourage satisfied customers to recommend our products and service to others.
- Provide the company with an opportunity to assess the improvement process.
The questionnaire must be
- User friendly
- Online
- Short (three to five questions)
- Use open questions (not yes/no answers) like: Rate your level of satisfaction with the company’s service, from 1 = fully satisfied to 5 = not satisfied.
- Enable fast & easy rating by clicking on. Rating is the only valuable information the company derives from these questionnaires.
Analyses, improvements, and assessment
To promote improvement the surveys must be analyzed truthfully. Do not cut corners or adjust the results to make yourselves feel better. Follow the results over time and search for opportunities to improve.
Frequency: I recommend conducting customer satisfaction surveys with each customer once a year or at the end of mutual projects.
Summary and recommendations
Three KPIs are added to this article to the list of KPIs presented in the previous six articles.
- Products’ contribution to operational profit and EBITA
- Bill of material (BOM) precision.
- Customers’ feedback
These KPI must be analyzed periodically, not on a regular basis (daily, weekly, monthly, annually).
Collecting and analyzing the data is very important. It must be consistently performed by the highest management of the company.
Summary of the series
In this series of articles, I presented KPIs under the responsibility of CEO and management members. Managers cascade the KPIs to managers and employees under their responsibility, in accordance with their accountability.
For example, operational managers are responsible for the overall OEE KPI. They must implement OEE KPI in the various departments and various shifts. Sales managers are responsible for meeting the company’s sales targets KPIs. They must set targets to the staff they manage. The same goes for all other positions in the company.
Dashboard
The monthly data must be loaded onto a color-coded dashboard that visualizes the KPIs’ results.
Green: KPI results that meet the target by 98% or more.
Yellow: KPI results that meet the target by under 98% but more than 92%
Red: KPI results that meet the target by under 92%.
Let us look at the table below:
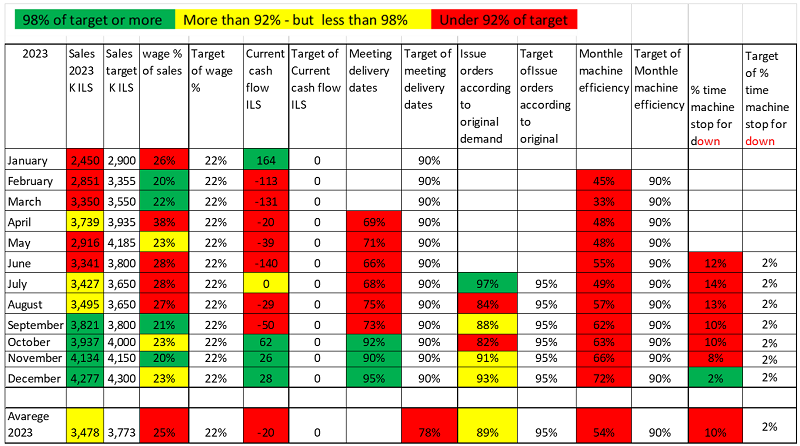
Note that most of the KPIs show improvement throughout the year.
Actions for improvement
To reach improvement, CEOs must summon the field managers for a monthly meeting to assess and discuss the KPIs’ results.
It is important that all the KPIs included in the seven chapters of this series are discussed at the meeting, and a visualizing dashboard is used.
Links to previous articles in the series
- Important KPIs to run a business – part I: The KPI reports CEOs Regularly measure
- Important KPIs to run a business – Part II: Human Resources and Finance
- Important KPIs to run a business – part III: Supply Chain
- Important KPIs to run a business – part IV: Operation and sales
- Important KPIs to run a business – part V: Quality and Marketing
- Important KPIs to run a business – part VI: Research, Development & Engineering


 My First Book: Manage! Best Value Practices for Effective Management