The article is based on chapter 28 of my book Management! Best Value Practice for Efficient Management : A Toolbox
How to set priorities in a sea of data?
TheMarker newspaper, February 8th, 2017 quoted the Israeli Ministry of Finance: “20% of Israeli citizens pay 85% of the national Income tax”. This statement demonstrates the Pareto principle, or ”Rule 80-20”.
The Pareto principle, articulated by the Italian economist Vilfredo Pareto (1848 – 1923), means that 80% of the outcome is determined by 20% of the active factors. For example: Pareto found that, in his time, 80% of the Italian wealth was held by 20% of the Italian citizens. This rule can be found in many cases , even if not exactly 80-20.
How does it help us?
The Pareto principle helps us to set the correct priorities when allocating resources.
Let us assume that we wish to improve the company’s profitability. To do that, we take a look at the company’s products’ performance. The company sells 20 products. We then insert those items into a table - the product generating the highest profit will appear at the top row of the list, and the product generating the lowest profit will be the last item on the list.
According to the Pareto principle, there is a good chance that the first four products on the list produce around 80% of the company’s revenues. If we focus on improving the profitability of these four products, we will achieve substantial improvement on the company’s profitability in an effective way.
Let us examine the following example
A shoe manufacturer sells 10 models. The company’s sales circulation is 10 million NIS per year. The company breaks even: doesn’t lose and doesn’t profit.
The table below presents the a list of the items, sales & profit and loss of each item.
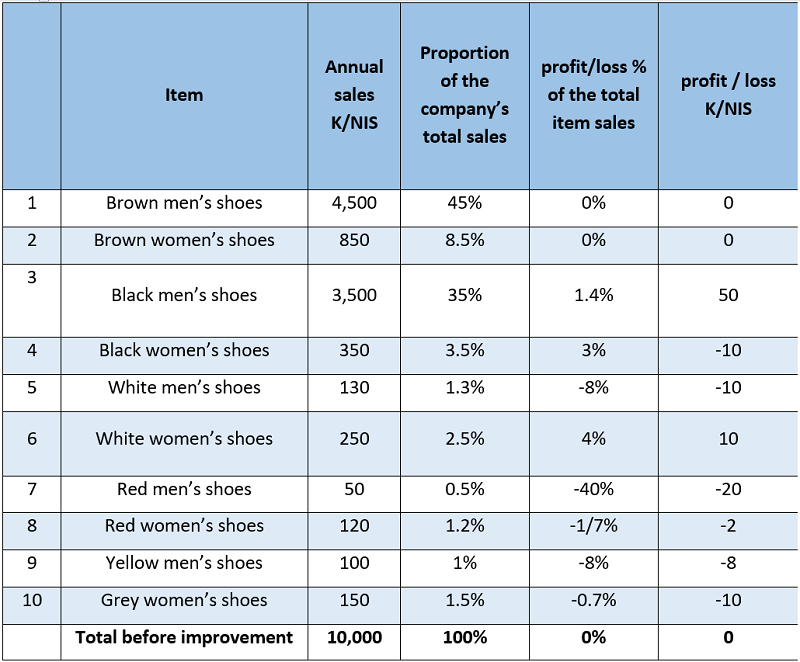
The company’s management decided to turn things over, to personally engage the employees and, with assistance from improvement teams, to enhance productivity. Due to local circumstances, it was decided to operate 2 improvement teams only. Team “A” chose to address the profitability of brown shoes because the sales revenue of that item was the highest. The item had achieved profitability improvement of 5% of the annual revenue for that product.
Team “B” chose to address the profitability of the red shoes because it had achieved significantly high profitability, overcoming a previous loss of 20,000 NIS.
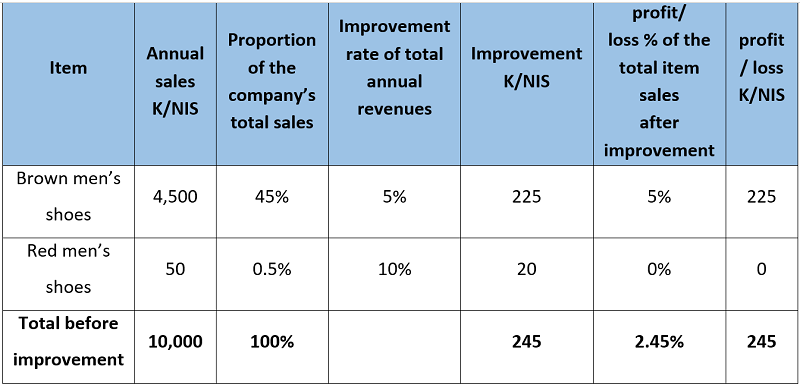
Addressing the issue of the red shoes profitability achieved an improvement of 40% of the annual revenue of that product. Addressing the profitability of the brown shoes achieved an improvement of only 5% of the product annual revenues. despite that, the contribution of the brown shoes improvement was much more significant:
225,000 NIS vs 20,000 NIS.
From the company’s point of view – the improvement of the red shoes profitability was negligible. Team “A” acted correctly when it analyzed and improved the profitability of the brown shoes. However, the action taken by team “B” was a mistake. According to the Pareto principle, team “B” should have addressed the second item on the list of most profitable items.
Let us take a look at the original list of items. After the data had been arranged in the declining sales volume order - top selling item at the top of the table, second selling item at the second row and so on until the worst selling item at the bottom row of the table - it was easy to see that the first two items, which form 20% of the 10 items, were responsible for 80% of the company’s annual sale volume. This example was made up to demonstrate a perfect Pareto principle, but in fact, it usually reflects an accurate picture.
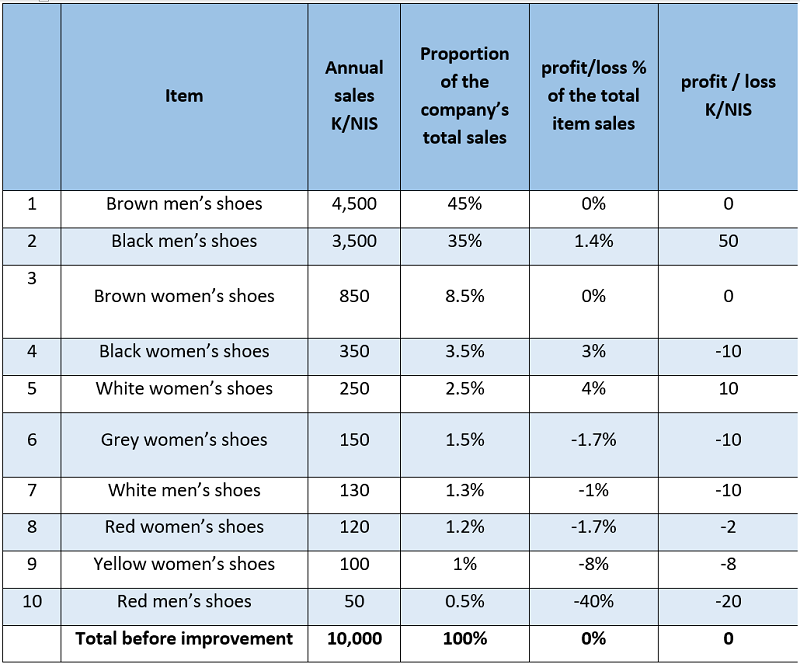
Had both improvement teams addressed the two top leading items, which are responsible for 80% of the sales, the results would have been much better.
Team “A” would have operated in the way it did, achieving 5% profit improvement of the men’s brown shoes. However, if team “B” acted according to the Pareto principle, it would have addressed the second item on the list, i.e. black men’s shoes. Assuming that team “B” were to also achieve 5% improvement of sales, it would have added 175.000 NIS revenue (over and above the 50,000 NIS achieved in the example) thus increasing the profitability of this item to 225,000 NIS. This would have brought the company to a total revenue of 400,000 NIS as opposed to 220,000 NIS achieved after the teams completed their tasks in the above example.
Let us look at a table demonstrating the results had the teams followed the Pareto principle:
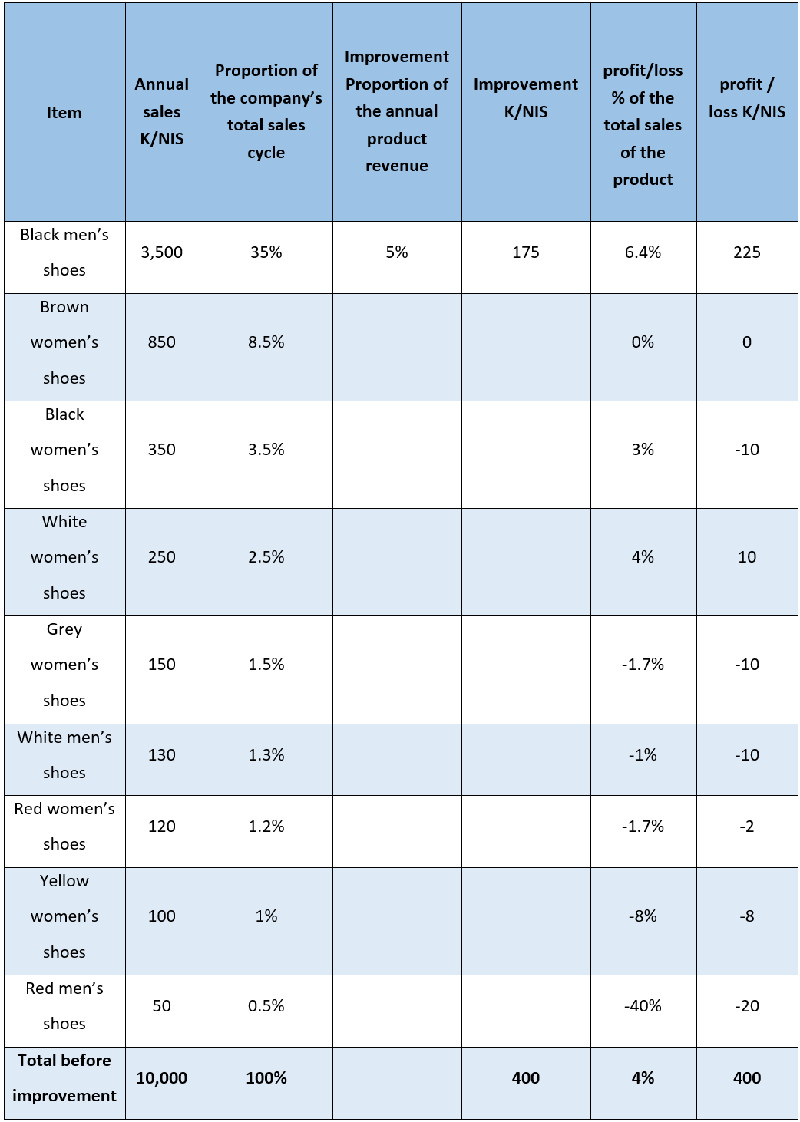
For Look at the following illustration.
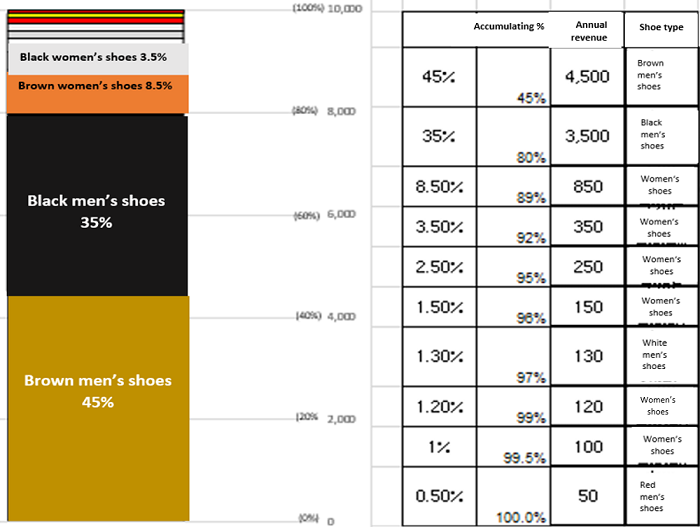
Annual revenue distribution by shoe type (K/NIS).
Summary and recommendation
The Pareto principle, or the rule of 80-20, shows that around 20% of the operating factors determine around 80% of the results. This rule enables us to set the correct priorities by focusing on the factors which have the most impact on the results (approx. 20%)
The example above shows how allocating resources in accordance with the Pareto principle can produce better results for the same investment ( the efforts of two improvement teams).




 My First Book: Manage! Best Value Practices for Effective Management