
This is the last chapter from my new book: Manage! Best Value Practices for Effective Management. the full book is can be purchesed on Amazon - click here to see more details.
The purpose of this book is to provide a fresh look on how you can improve business results by making your company matter to your employees.
The book's cover:


https://business-excellence.co.il/en/my-blog/680-last-chapter#sigProIda626c940f0
Statistical quality control – What is it? How to use it?
Given correct instruction and on-the-job training, any production employee will be able to perform this critical quality inspection and will enjoy doing it.
Earlier this morning we climbed the mountain on our bikes. The slope was quite easy and it was possible to chat. Joshua, an R&D manager in a large aerospace company, said that with automation it was possible to compete with the Chinese cheap production lines. Ronny, a hi-tech person, commented that automation insures uniform quality at all times.
Anybody who is familiar with automated production close enough knows that there are no miracles. Deviations from the defined production process are bound to occur for different and varied reasons.
Whether automated or manual production – quality inspection is indispensable. Under any circumstances, even when the production process is stable, we should perform quality inspection on the outputs of the production line every 30-60 minutes. This monitoring process is based on statistical principles.
Why is inspection required?
I will demonstrate the method using a packaging process.
Consider a food producer who packages lentils in bags of 250 grams each. The producer uses a computerized, multiple-head packaging machine. It consists of 14 small weighing cells.
The lentils are poured into the cells and the computer continuously searches for the combination of 2-5 cells that will yield 250 grams.
This is an accurate packaging machine but, from its description, it is clear that the resulting weights of the bags will not be uniform; they may be close to 250 grams, but not exactly that all the time.
On the one hand, the manufacturer will strive to fill as little extra weight as possible (Note that the customer pays only for 250 grams so, if the bags weigh 300 grams then revenue would be lost).
On the other hand, the manufacturer will not want to fill less than 250 grams per bag in order to maintain credibility. Therefore, the manufacturer will calibrate the weighing system such that the difference between the packaged portions will be the smallest possible and closest to what is written on the bag (in our case: 250 grams).
How shall we perform the inspection?
Once an hour, and when the process is not stable once every 30 minutes, we will take a sample of 5 consecutive finished bags, weigh them, and calculate two values:
(a) The average weight of the 5 samples, and
(b) The range between the lightest and the heaviest bag in each sample.
Then we will plot the results on two separate recording sheets.
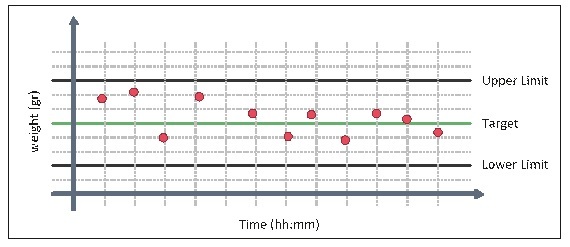
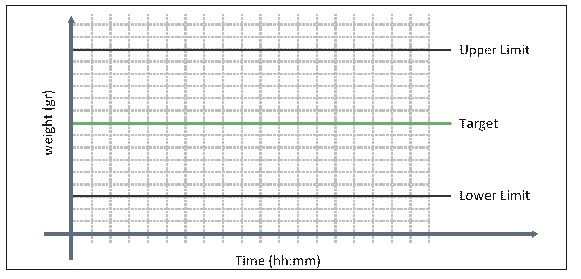
Look at Figure 1 (Average Weight)
We can see that the dots (which are the average weight of 5 bags) spread far from the middle line (see left side of the drawing); at other times we can see the dots are closer to the middle line (see right side of the drawing).
Our objective is to fill the bags such that the dots will appear as close as possible to the middle line, which represents the target weight (250 grams).
Figure 1: Sample Average Weight
Now examine Figure 2
The red dots on the left are far below the target; they fall even below the lower limit; therefore, the operator must stop the process and modify the weighing system or call a technician to fix it. Obviously, in such cases it would not be wise to wait until we receive 4 samples and a corrective measure should be taken immediately.
An opposite situation is exemplified by the light-blue dots at the center of the graph, which fall above the upper limit. Here, too, the weighting system must be fixed immediately.
The yellow dots on the right end of the drawing, although falling within the Figure 2: Sample (Internal) Weight Range
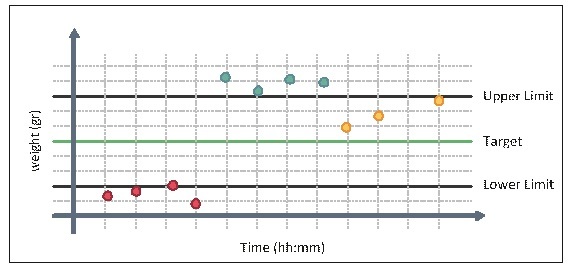
limits, show that the process is diverging toward the upper limit and that most probably something went wrong. Thus it would be wise to stop the process and fix the problem before the dots exceeds the limit.
Note that the yellow dots should alert us for another reason. In "normal" status we expect to get an even spread of the dots around the middle line. Statistically, the probability of the samples falling only below or only above the target line is about the same as seeing a family with 7 daughters.
It is possible, but under normal circumstances the chances for of this to occur are very slim. That is why seeing this result should serve as an early alert. It tells us that we need to check whether the setting or something in the process has changed.
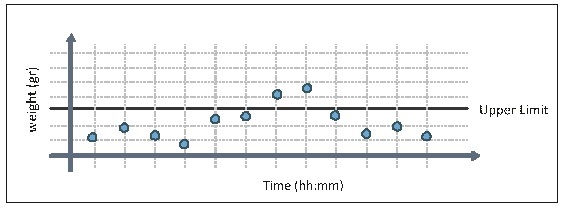
Now look at the Figure 3
Each dot represents the range (in grams) between the lightest and the heaviest bag in each 5-bags sample. Our objective is to keep the range below the upper limit. Later on we will explain how to calculate the upper limit. Here again, in case the dots exceed the upper limit, or in case we see a clear trend towards it, we must fix the weighting system.
So far, we have described the system as seen by the operator; but how should we define the target line and the limits?
At this stage, we go a little deeper. Take a moment to see the logic behind this method in a simple and straightforward manner. It will be worthwhile even if you are not familiar with statistics.
Figure 3: Sample of Internal Weight Range
What is statistical quality control?
The word statistics may be intimidating. However, in the field, at the production line, its use is very simple (as we have seen above.) First, let us understand the basic terms:
Normal population: we assume that when we take "enough items" of a given population, the variability between the items will be of similar characteristics. The term "enough items" refers to a group of at least 30 items. Remember this number: it will become important later for defining the limit lines discussed above.
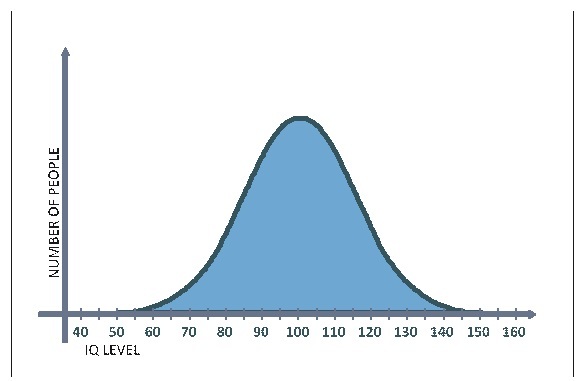
Standard Distribution: The distribution of the items of a given population is called "normal distribution" or "Standard Distribution". For example, when we plot the distribution of IQ (Intelligence Quotient) among adults, we get the graph shown in Figure 4.
This is a typical normal distribution of a trait in a large-enough population. It resembles the shape of a bell and is called "Gauss Bell", so named after the mathematician who first reported this observation.
The Gauss Bell
The Gauss Bell is the ideal shape of a normal distribution. The X-axis (horizontal) depicts the IQ level while the Y-axis (vertical) depicts the number of people who have this level of IQ. In this example, we can see that the average IQ is 100.
The majority of the population is located close to the average. The farther away we go from the average (either to the left or to the right), the lower the number of people.
We will get a similar distribution when we measure the height of the same population; and the same will hold true for many other attributes when we measure large-enough populations (the minimum sample is usually 30). Note, however, that while the overall shape of the standard distribution.
Figure 4: Gauss Bell
curve is similar for different traits, the proportions of the bell curve (height and width) will differ from case to case.
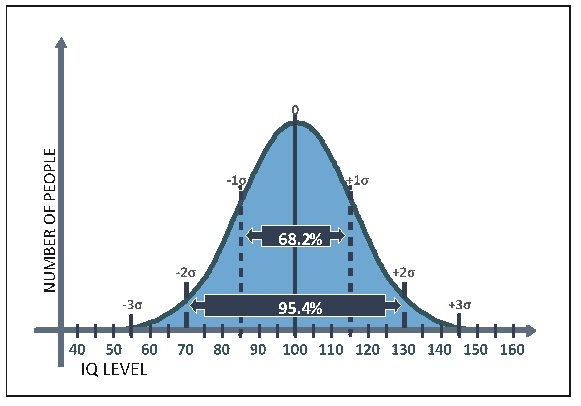
Standard Deviation: We represent the dispersion of a given population around its average by the term Standard Deviation, which is symbolized by Greek letter σ (sigma). Without going into the calculation of σ, we will now see how it is used.
Examine Figures 4a and 4b below: After calculating σ, we measure and mark segments of one σ on the horizontal axis on both sides of the centerline (the average line). It has been proven mathematically that 68% of the population is included in the area bounded by ±1σ; 95.4% is included within ±2σ; and 99.7% is included within ±3σ.
Figure 4a
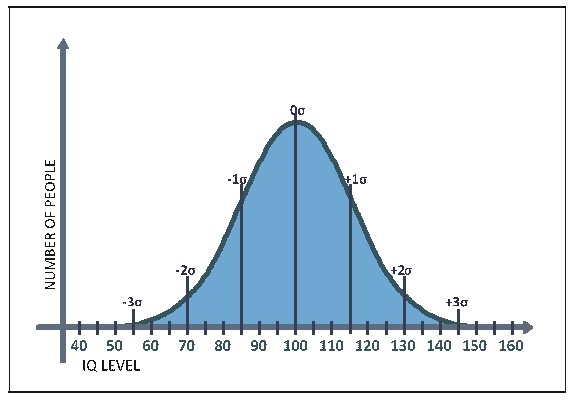
Figure 4b
Defining the sample limits from the Gaus Bell
We come back now to our lentil packaging machine.
Look at Figures 5a, 5b and 5c below
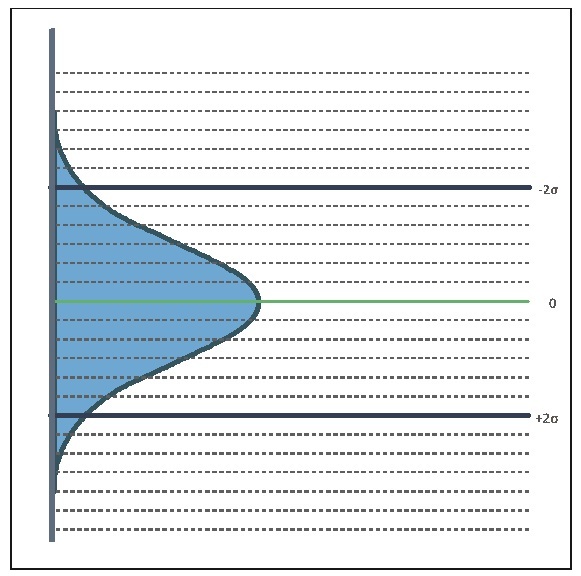
We turned the Gauss bell from Figure 4b on its side and pulled the lines that represent the average weight and -2σ and +2σ. If our sample of lentil bags is "large enough" (more than 30x5), 95.4% of the dots should fall between the upper and the lower borders.
Another way of saying this is that the chance of a dot (representing the average weight of five bags) falling above the upper line or below the lower line is less than 2.5%. Therefore, if we see a dot outside of those limits, it is quite likely that the weighing system is not set correctly and we must check its setting.
Figure 5a: Gauss bell turned on its side
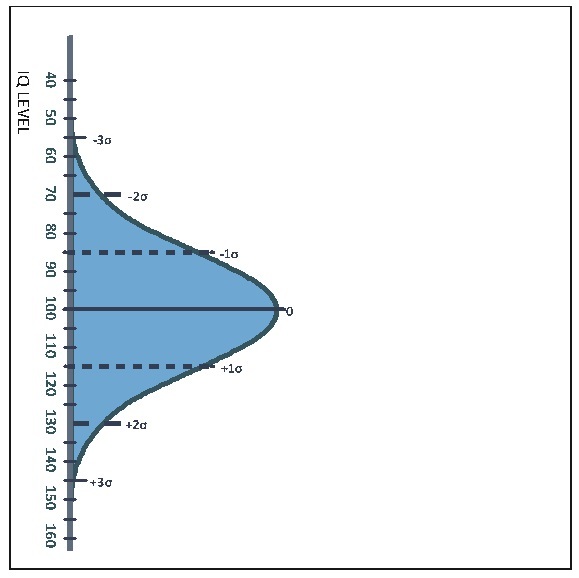
Figure 5b: Gauss bell with extended lines marking the -2σ boundaries and +2σ
How to calculate the standard deviation?
At the beginning of the process we weigh 30 bags and calculate their average weight and standard deviation (this is a common function in most calculators and is available also in Microsoft Excel ©). Once we draw the average line and the upper and lower limit lines on our control sheet, we are ready to start plotting the actual samples from production.
Figure 5c: Reporting sheet for the machine operator
Note: We recommend NOT to draw the Gauss Bell on the control sheet (see Figure 5C) because some employees may find it intimidating. However, it is highly advisable to tell the line operators the logic behind it.
Summary
The method demonstrated here using lentil bags is relevant for any production process, even if automated, including CNC machines. All employees can perform this type of statistical control. Given correct instruction and on-the-job training, any production employee will be able to do it.
Furthermore, this type of close monitoring adds meaning to the operator's work, provided she was introduced to it patiently and with proper background; and it is an excellent way to boost motivation and commitment for quality.
You can purchase the full book on Amazon, or directly through me. If you prefer to obtain it directly just send me a message.


 My First Book: Manage! Best Value Practices for Effective Management